Home
AirBnB Rental Price Data Analysis
Unveiling Insights for Prospective Hosts using Regression Analysis.
Goal
Primary goal was to understand the factors that significantly influenced rental prices in different neighborhoods with the use of Python / Pandas and data visualization.
Outcome
With the use of Multiple Linear Regression analysis and thorough exploratory data analysis the following were derived:
- Neighborhood plays a significant role: The location of the listing is a key factor influencing rental prices in Los Angeles. Different neighborhoods have distinct price dynamics, with some commanding higher prices than others. The more popular a neighborhood the likelier price will come down rather than neighborhoods in less competitive areas. Hosts should consider the desirability and amenities of a neighborhood when determining their rental pricing strategy.
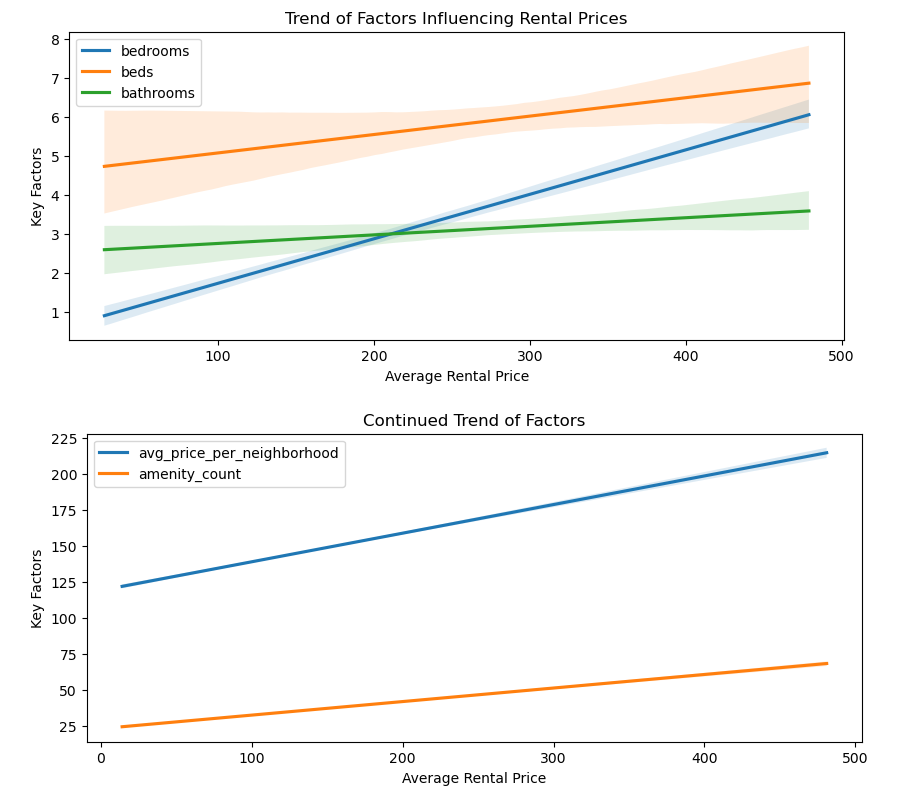
- Property attributes matter: The number of bedrooms, bathrooms, and beds in a listing has a significant impact on rental prices. Listings with more bedrooms and bathrooms tend to command higher prices, indicating the importance of space and accommodation capacity for potential guests. Based on a Multiple Linear Regression model, a host might expect an increment of around $46 an additional bedroom or an entire home/apt.
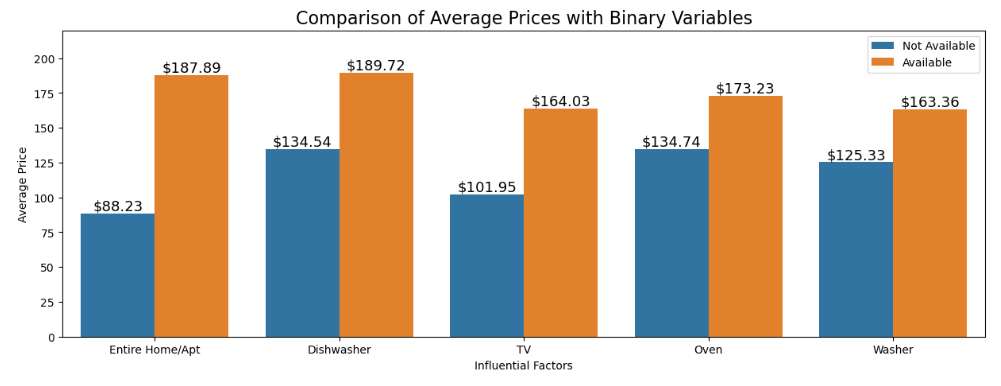
- Amenities can drive prices: The presence of basic or essential amenities in a listing, such as a dishwasher, tv, or washer, can positively influence rental prices. Hosts should highlight these amenities in their listings to attract guests and potentially justify higher prices. As an example, using the same modeling, hosts are able to increase their prices by around $21 just by offering a dishwasher.
The Process
The project extended over a timeframe of 4 to 6 weeks, during which extensive data cleaning, exploratory data analysis, and predictive modeling techniques were employed to gain insights into the factors influencing price fluctuations in AirBnB rentals.
Throughout the project, the P.A.C.E. methodology was utilized to establish a structured approach, ensuring meticulous planning and seamless execution. This project management framework helped stay organized at every step, effectively manage risks, and maintain work within scope and timeframe.
The early stages of the project were focused on data exploration, data cleaning, and transformation. It required an indepth review of the data dictionary provided by AirBnB, descriptive statistics of the dataset, and core functionality within Python packages such as Pandas, Seaborn, Matplotlib, and Numpy to investigate the state of different variables in the data.
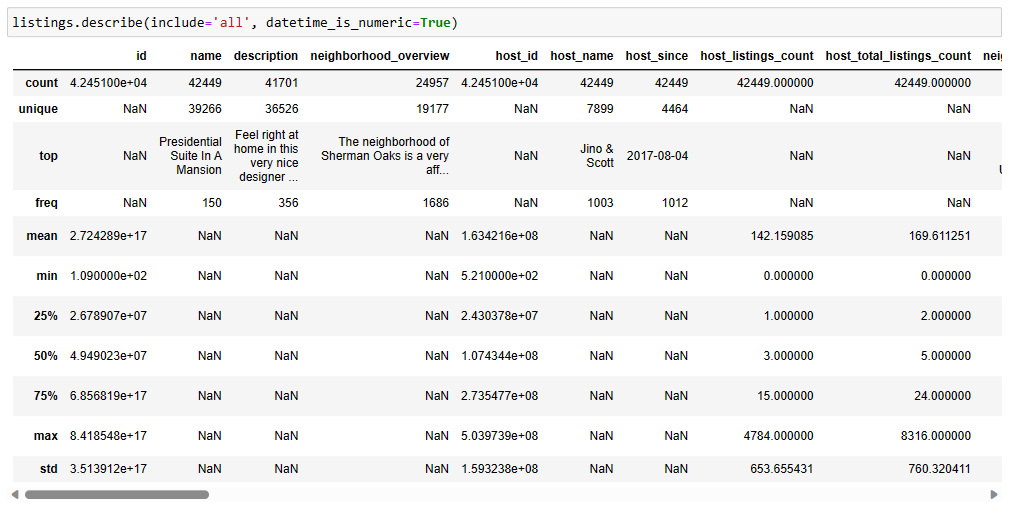
- Descriptive statistics used early in the project to get a glimpse at the data as a whole.
Once the data was thoroughly evaluated and processed, extensive exploratory data analysis helped investigate relationships between variables, gauging their impact against rental price, and representing that data visually to tell a better story overall.
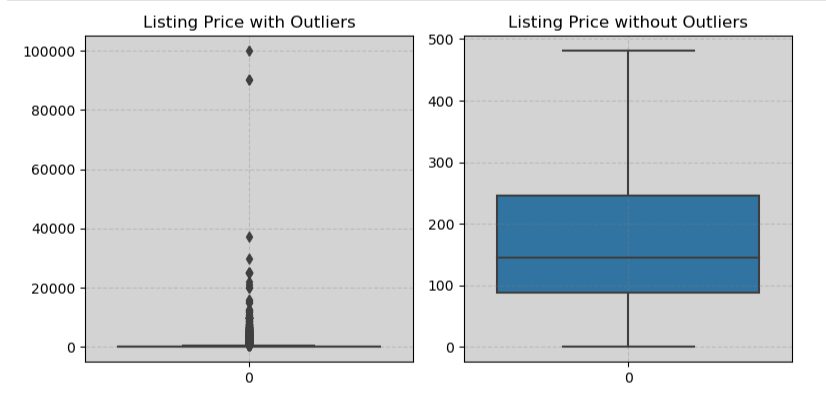
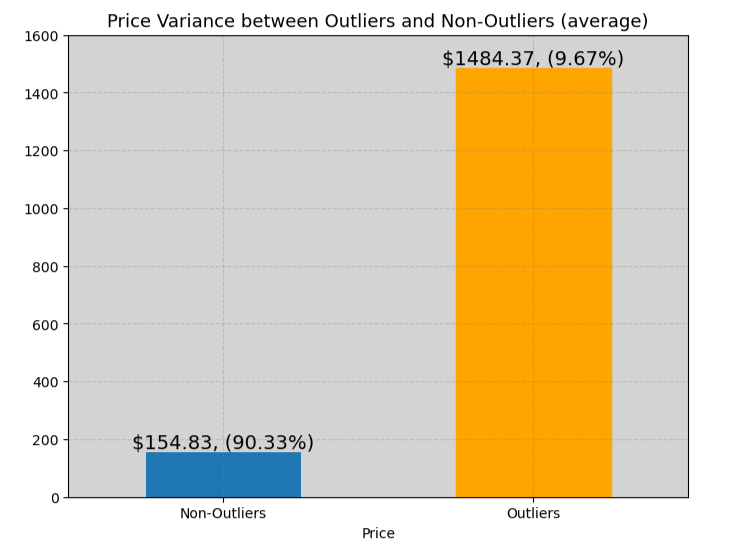
- These were among two of the most common visuals used to investigate outlier data with any variable of interest.
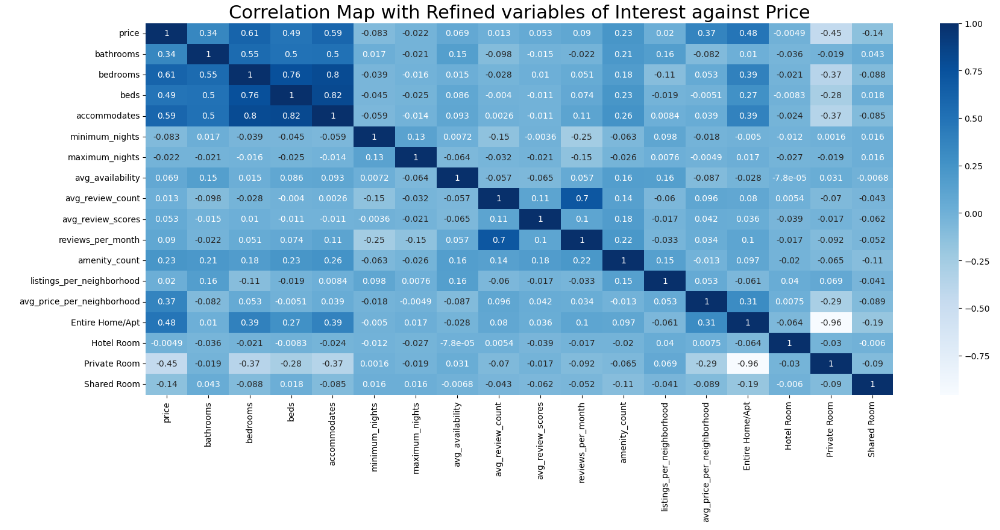
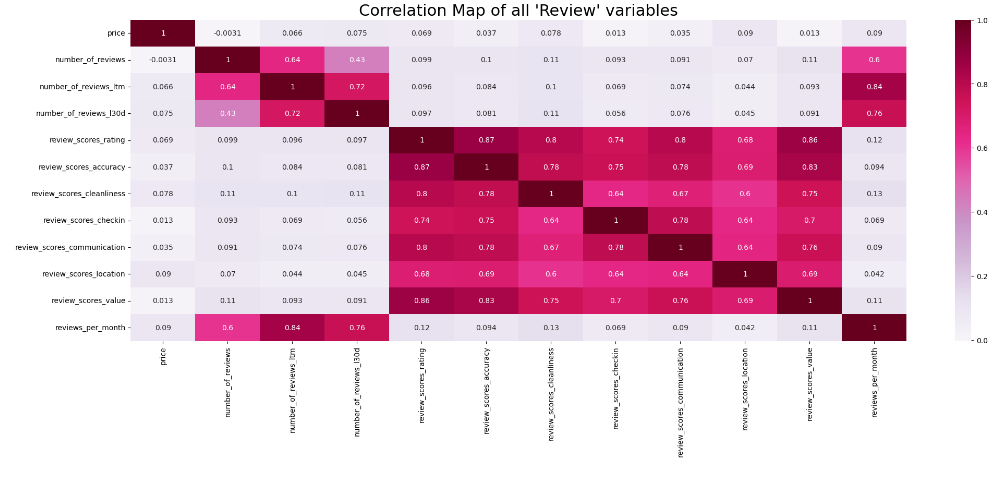
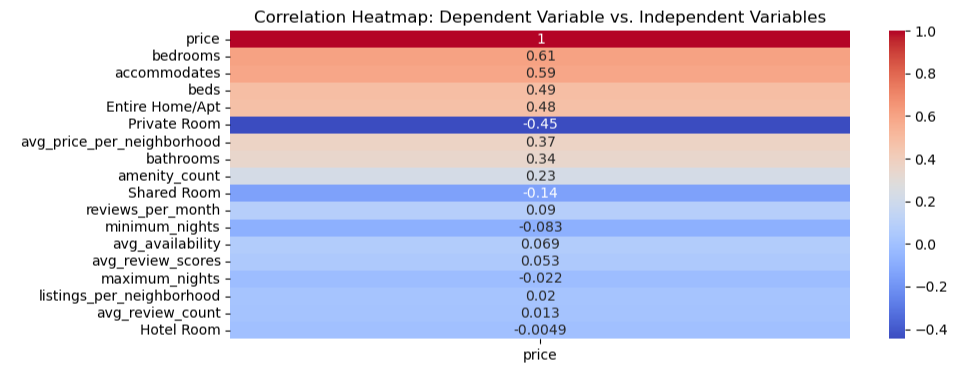
- These correlation heatmaps provided a roadmap for variable signficance. Based on their correlation to price, an ordered list of
variables were used to decide which would have a stronger impact upon modeling.
After a consolidated list of variables were selected for modeling, it was time to build a model which would best address rental price predictability. The model needed to be explainable, therefore, the best model with low complexity was a Multiple Linear Regression.
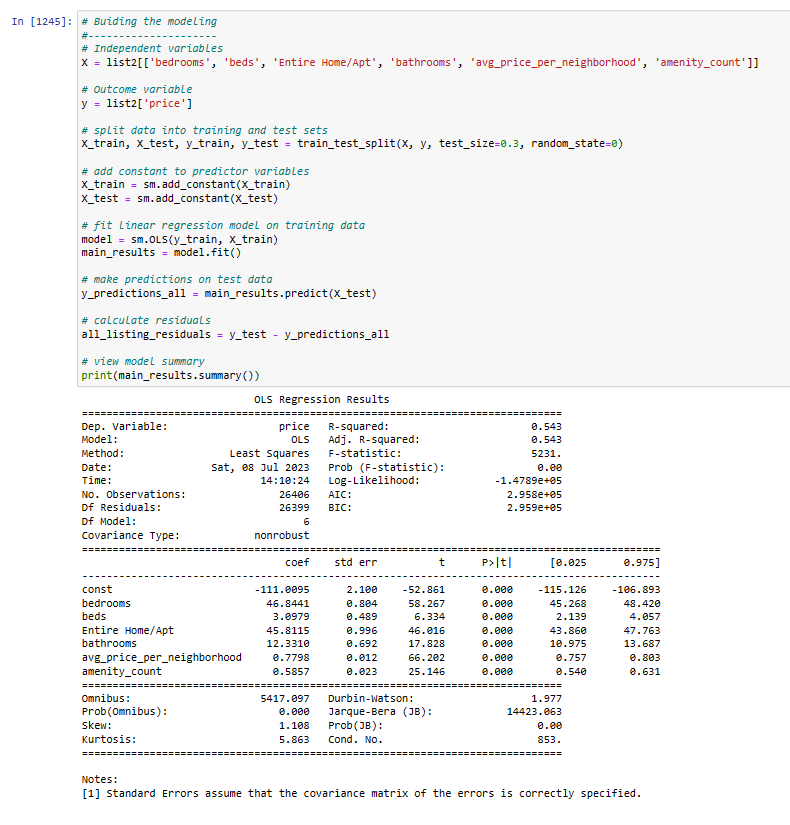
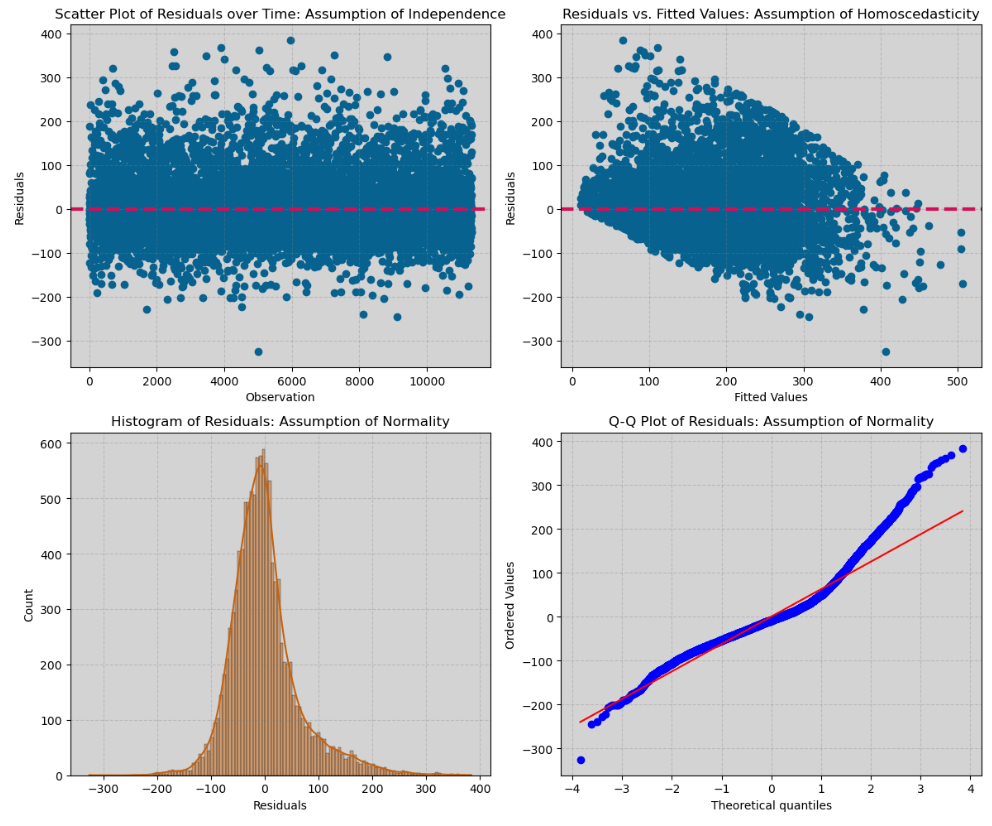

- Using the statmodels package to run a linear regression model, evaluating linear regression assumptions and visualizing model performance.
In order to assess the impact of the modeling on individual neighborhoods, a more focused analysis was performed using specific neighborhoods
as subsets of data. By evaluating the performance of the model within each neighborhood, additional insights were gained regarding the
statistical significance of the selected independent variables. In essence, while the model overall performed well (r-squared .54), performance
at the individual neighborhood level had drastic variances (ex: Sherman Oaks had an r-squared of .72, while Santa Monica had .22).
Ultimately, the data analysis revealed that the factors influencing rental prices in Los Angeles County varied across different neighborhoods.
While certain factors such as the number of bedrooms, type of rental property, and amenities offered showed statistically significant relationships
with price, the strength of these relationships varied depending on factors like neighborhood competition and demand. These findings emphasize the
importance of conducting further investigation in future projects to gain a deeper understanding of these dynamics.
Some future considerations:
- Neighborhood research: Further investigate the specific neighborhoods that command higher rental prices in Los Angeles. Explore the reasons behind their desirability and popularity among guests. This research can help listing owners understand the market dynamics and make informed decisions about targeting specific neighborhoods for their listings. Leveraging the reviews.csv file may help
- Price fluctuations based on Time of Year: Consider the busiest months or season per listing as a factor for price variance. Monitoring prices based on the busiest times of year. It's far more difficult to move a property from one neighborhood to another, than it is adjusting price based on the demand in a given time of year.
- Highlight amenities: Target amenities that go beyond essential necessities. Having a pool, children's dishware, or even shampoo may be influential amenities not considered necessities that have more impact in price variance.