Home
DogTime Breed Dashboard
An interactive Excel dashboard for dog breeds from DogTime.com
Goal
Provide an informative and interative dashboard that presents consolidated data from DogTime.com in the following ways:
- A dynamic view of the top dog breads based on key traits.
- Brief summary and insights on dog breeds based on data set.
- Visuals that summarize data by different traits.
Outcome
The dashboard provides a comprehensive and interactive experience for dog enthusiasts. It offers a customized mini-profile of the top dog, dynamically generated based on a selection from a range of pre-made profiles or user-defined traits. It showcases valuable insights and data-driven information to help new or experienced dog owners make informed decisions and gain a deeper understanding of various dog breeds and their characteristics.
View the dashboard on my Github.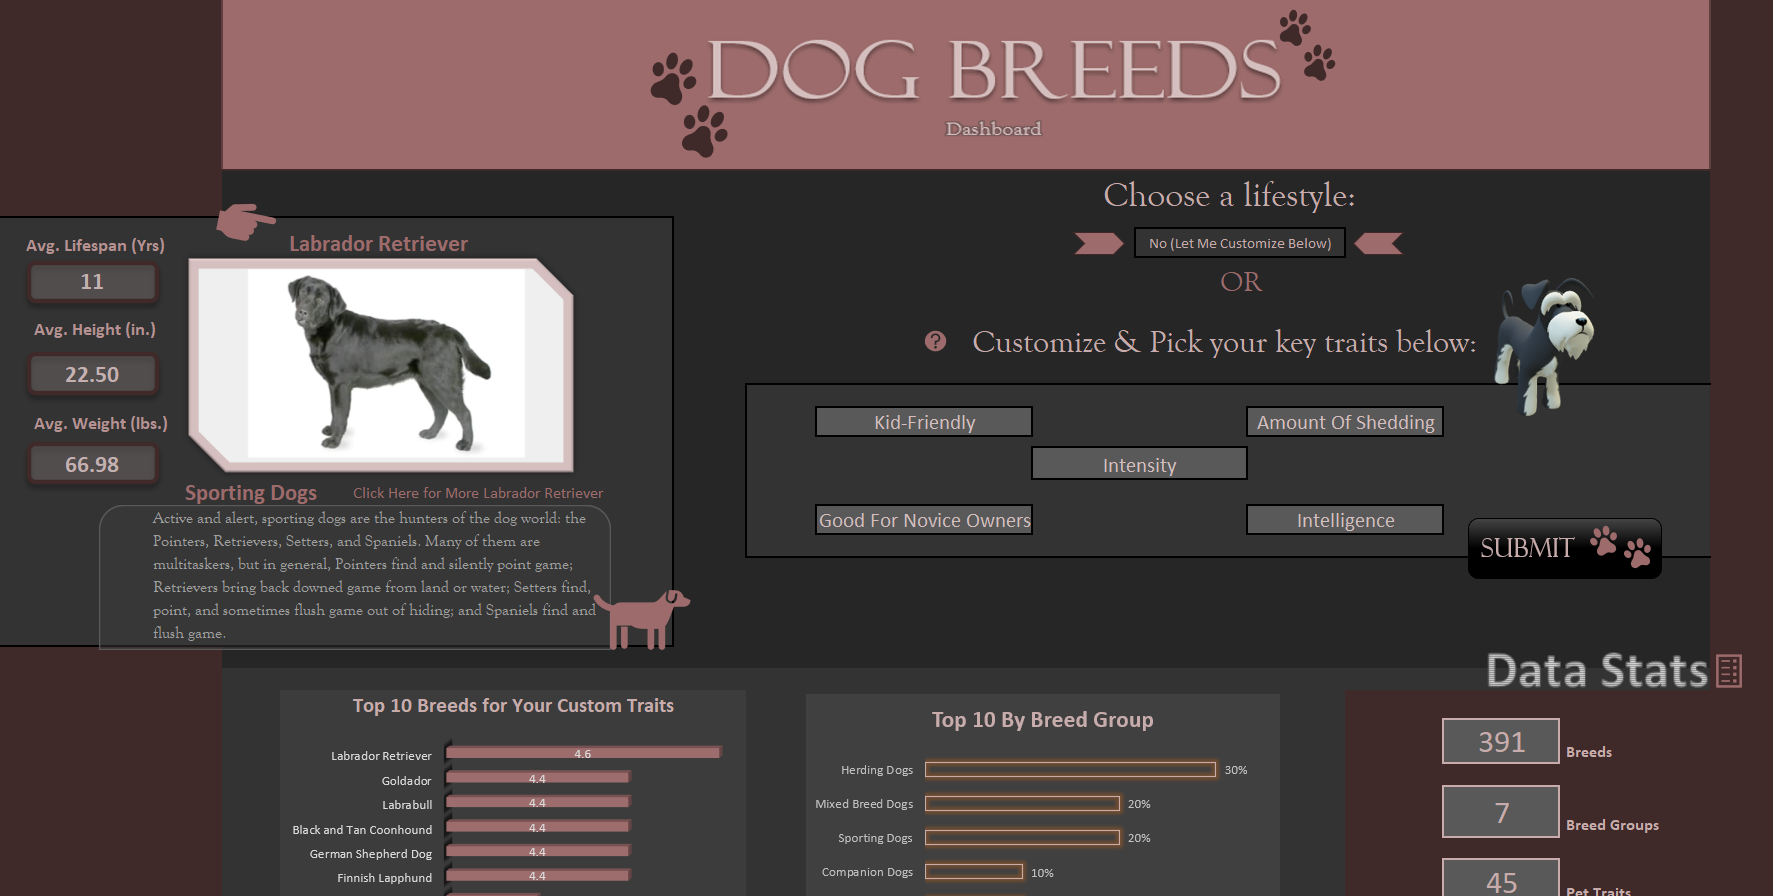
The Process
The project spanned a duration of 2 to 3 weeks, encompassing a well-structured and systematic approach involving meticulous planning, efficient organization, comprehensive data exploration, and effective visualization.
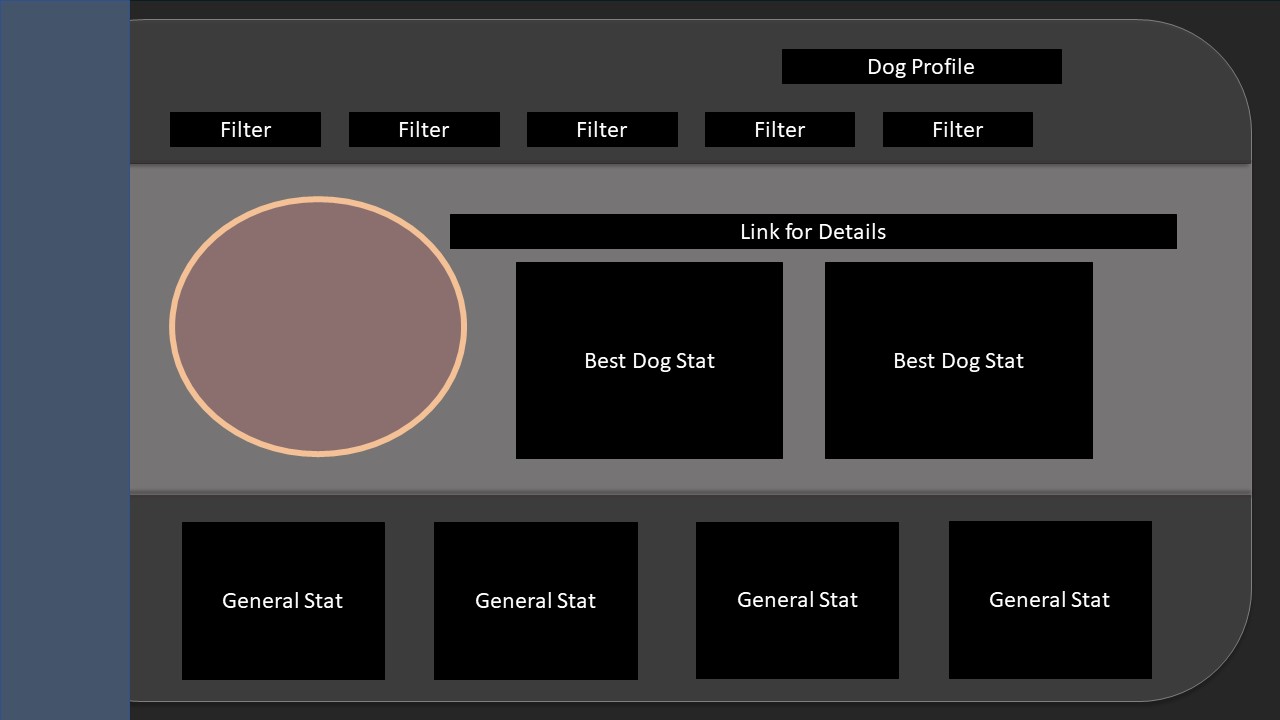
At the outset, a dashboard mock-up was created using powerpoint to streamline and categorize the essential information required for the project. This strategic step allowed for a focused project scope while being mindful of the allocated time frame.
With a strategy set, proper data exploration was conducted to understand the features further. That involved building proper pivot tables and filters to gain insights on summarized subsets of data. Based on the type of feature needed in the dashboard a seperate excel sheet was used to organize data accordingly. That efficiency reduced time in troubleshooting and validating the final dashboard.
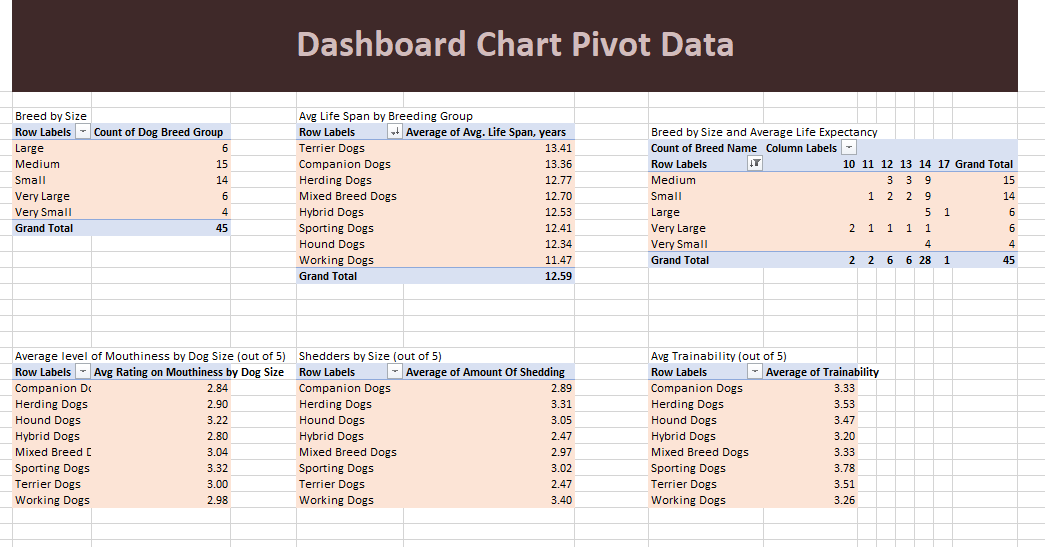
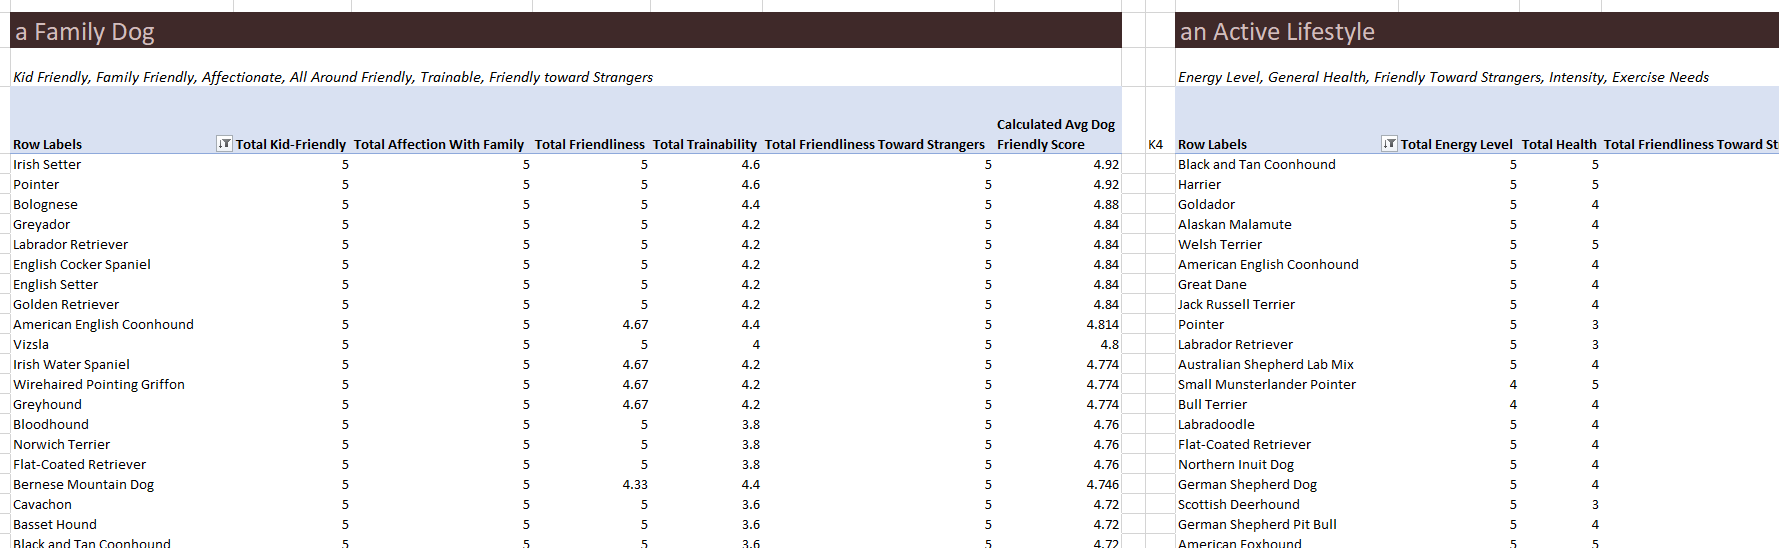
- These pivot tables helped organize some of the analysis presented in the dashboard
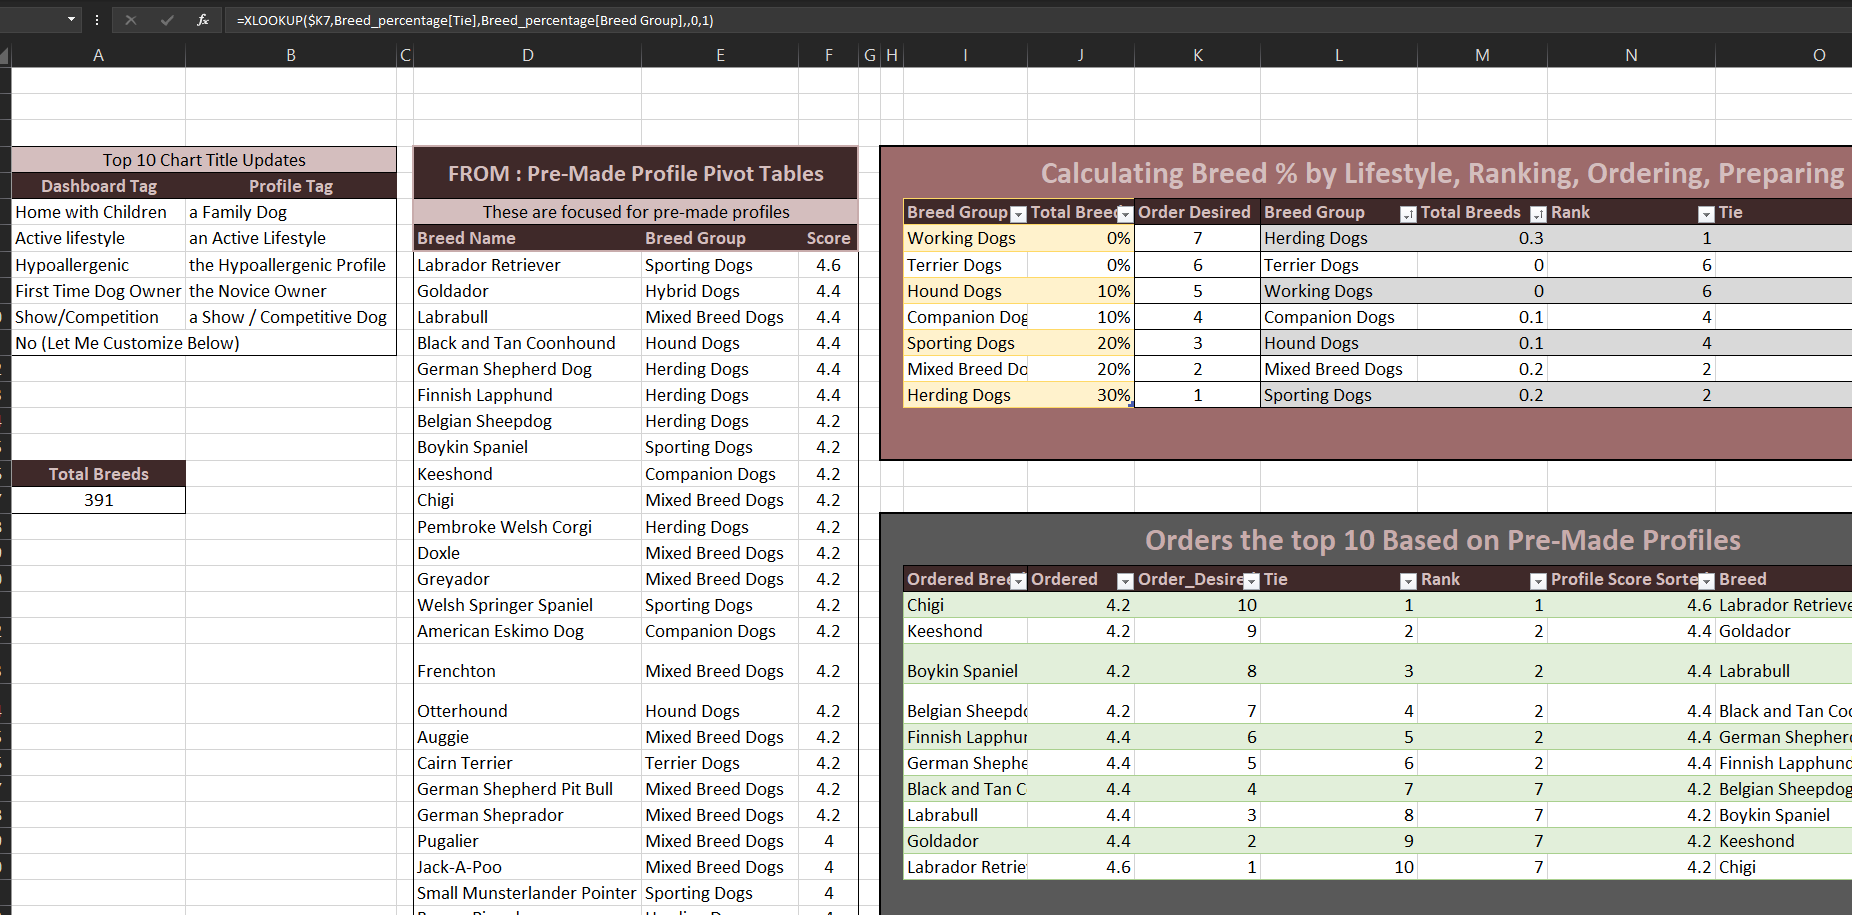
- This was part of the process in building pre-made profiles and setting a fetching process
that gathered data into the final dashboard using Xlookup and Index/Match functionality.
With a mockup in hand, and a representational subset of data prepared, building the dashboard was the final stage in the project, and the most time consuming step. However, the strategy implemented worked as intended, providing a focused scope for the project without compromising on quality and the main goal.
Overall, this project demonstrates the ability to explore and organize data using a widely and popularly known tool like Excel, by using functionality like pivot tables, xloopup, index/match, if statements, and aggregate functions.
Some future considerations:
- Conducting user testing and gathering feedback will help identify areas for improvement and ensure that the dashboard meets the needs and expectations of its users.
- Expanding the data sources beyond Kaggle.com to include other reputable dog-related websites or databases would enhance the comprehensiveness of the dashboard.
- Integrating social sharing features would allow users to share their findings and recommendations, thereby fostering a community-driven platform for dog enthusiasts. Collaborating with veterinarians, breeders, or dog trainers could provide valuable insights and expertise to enrich the dashboard's content and recommendations.